Chi-square test in Power BI
In this post, we will see how we can implement the Chi-square test in Power BI using DAX only.
There are three main types of chi-square tests but in this post, we will focus only on the chi-square test for independence.
Table of Contents
What is Chi-square?
A chi-square test for independence compares two variables (which can hold multiple values) in a contingency table to see if there is a relationship between each other. In other words, it tests to see whether distributions of categorical variables differ from each other.
Another common type of Chi-squared test (not covered in this post) is called the “chi-square goodness of fit test” it helps to determine if a sample data frequency matches a known or assumed population frequency.
Chi-square Real Life Examples
- Social research: to determine if there is a relationship between a voter’s opinion and their level of income
- Clinical trial: to determine if the treated group and control group are associated with each other or not (similar outcome after real treatment and inert treatment)
- Market Research: To determine if certain types of products sell better in certain geographic locations than others
Chi-square Assumptions
Before jumping into the implementation of the Chi-square test in Power BI let’s see what are the assumption of the chi-squared.
- Both variables are categorical
- All observations are independent
- The values of each variable are mutually exclusive.
- The sample size should be large enough, in theory, at least 80% of the cell “expected” should have a value greater or equal to 5 and no cell should be equal to or lower than 1. Fisher’s exact test would be more appropriate in such scenarios.
- The study groups must be independent
How to implement the Chi-square test in Power BI
Why implement a Chi-square test in Power BI with DAX instead of R/Python?
- Fully interactive visuals; custom visuals using R or Python are not
- Security policy within your organisation: Limitation to deploy python or R script to the portal
- Force you to better understand the test statistics process
- Easier to maintain: one language, one tool, integration and deployment easier, reusability
- No need to know other languages such as R or Python
The data
To implement the Chi-square test in Power BI I used a dataset that contains data about a clinical trial which involved 105 patients separated into two groups “Treated” and “not treated”.
50 patients received a real treatment (“treated” group) while 55 received a placebo (“not treated” group). After two months we compare and observe the improvement ratio between the two groups.

The model
The model contains the main datasets that I described above and a parameters table CI which I will describe later.

The contingency table can be created with the DAX code as follows:
Hypotheses
By looking at the contingency table above it seems that the health condition of treated patients has improved after 2 months, now we need to confirm whether this was due to chance or if theis positive effect of the treatment is statistically significant.
So here the null hypothesis (H0) states that the distribution of the health condition outcome is independent of the two groups (treated and not treated).
The alternative hypothesis (Ha) states that there is a difference in the distribution of the health condition outcome among the two groups (treated and not treated).
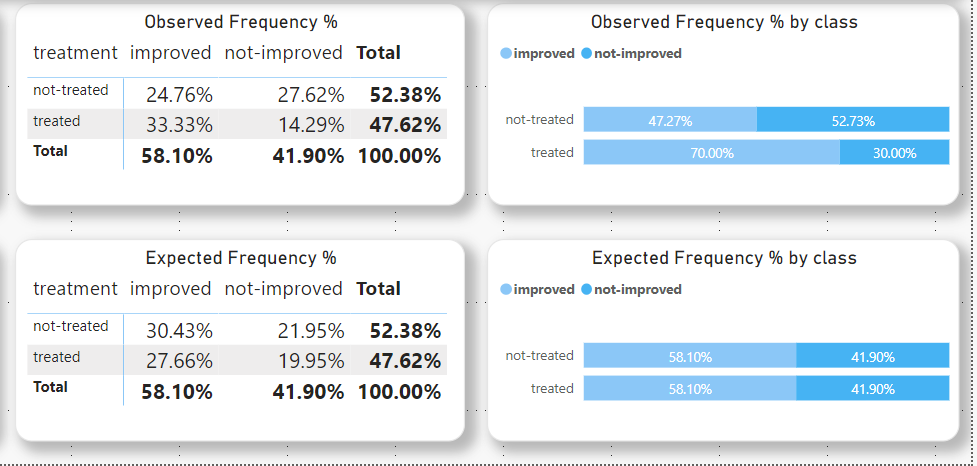
Observed Frequency
The observed frequency is basically the number of values in each category or group.

Expected Frequency
Before computing the Chi-square test in Power BI we first need to calculate the expected frequency.
The expected frequency is expected to be the same for each category as it is basically going to calculate the average frequency or count and assign it to each category or group.
To calculate the expected frequency we always assume that the variables are not related to each other
And the DAX formula is as follows:
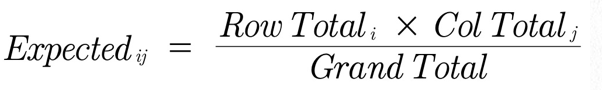

For example, to get the expected frequency of group=not-treated & and health condition=improved we compute (55*61)/105=31.95
Observed Frequency vs Expected Frequency
In order to run the Chi-square test in Power BI, we simply need to compare the Expected Frequency with the Observed Frequency.
In this scenario, it seems obvious that there’s a significant difference between the two groups, however, depending on the confidence interval that we want we may not be 99% sure that the observed change is not due to chance so we do need a statistic test to confirm it.
Also in more complex scenarios when we have more than two categories, the result is less intuitive.
Chi-square or X2
The formula to compute the Chi-Squared is pretty straightforward since we already have computed the Observed and Expected Frequencies.

 | chi-square |
 | observed value |
 | expected value |
Here is the DAX formula to compute the Chi-square test in Power BI
In order to validate or reject the null hypothesis, we now need to compare the Chi Squared statistic to the critical value or calculate the p-value.
An important note here is that whether the observed frequency is smaller or larger than the expected frequency makes no difference in the X2 result. So the greater the difference between the two groups is (< or >) the higher the X2 will be.
Degrees of freedom
The degrees of freedom (or df) are used to determine the critical value or to compute the p-value.
Usually, degrees of freedom relates to the size of the sample so a higher df means a larger sample and thus reduces the false positive ratio,
For Chi-Squared the degrees of freedom do not rely on the sample size but on the number of groups and categories to analyse so it tells us how many values in our grid are actually independent.
The formula of the DF for the chi-square is as follows: df = (r-1)(c-1) where r is the number of rows or groups and c is the number of columns or categories
| r-1 | nb of rows – 1 |
| c-1 | nb of columns – 1 |
| deg of freedom | (r-1)(c-1) |
Since there are two columns and two rows in our scenario the df is equal to 1: (2-1)(2-1)=1
Chi-critical value
The chi-critical value is the cutoff between retaining or rejecting the null hypothesis. If the chi-statistic value is greater than the chi-critical value, meaning it is beyond it on the x-axis, the null hypothesis is rejected and the alternate hypothesis is accepted.
Here is the DAX formula to calculate the ci critical value:
To calculate the critical value we use the DAX function CHISQ.INV.RT which requires two parameters the probability associated with the chi-squared distribution and the degrees of freedom.
As for the probability or level of confidence we have in our model a table which allows us to dynamically change the value of the probability.

So with a confidence interval of 95% and with a degree of freedom of 1, the critical value is 3.841.

To find more about the critical value or how to calculate it by hand you can refer to my previous post PAIRED T-TEST IN POWER BI USING DAX and read the t-critical value section which is more elaborate than this post. (The only difference is that for a chi square test we will need to use the chi distribution table instead of the t distribution table)
One important thing to note is that we usually run a right-tailed test for the Chi-Square test since we want to test the difference between the two groups.
A Chi statistic value greater than the upper critical value would mean that there is a significant difference between the two groups while a Chi statistic value below the lower critical value (left tail) would mean that the resemblance between the two groups is too good to be true.
p-value
A p-value is used in hypothesis testing to help us support or reject the null hypothesis. The p-value is the evidence against a null hypothesis. The smaller the p-value, the stronger the evidence that we should reject the null hypothesis.
The built-in DAX function to calculate the right-tailed p-value of the Chi test is CHISQ.DIST.RT. This function requires two parameters the chi-stat and the degrees of freedom.
And here is the DAX formula:
Note that in this post we only run a right-tailed test for a chi-square test but there’s also another DAX function to run a two-tailed test but it is rarely used for a chi-square test.
Confidence Interval
Strictly speaking, since we are only checking if two (or more) variables are independent there is no confidence interval for a chi-square test such as in the t-test.
In the Power BI, you can interact with the slicer “CI” which gives the level of confidence to reject the null hypothesis under a specific percentage. And of course, the higher the probability the higher the critical value will be. And the higher the probability the smaller the p-value will need to be to reject the null hypothesis.

Result
And here is the final result of the Chi-square test in Power BI as we can see there is a statistically significant difference between the expected frequencies and the observed frequencies since the X2 is greater than the critical value and/or the p-value is lower than the alpha 0.05.

Conclusion
In this post, I covered the implementation of the Chi-square test in Power BI but I only focus on the most common chi test which is Pearson’s chi-squared test, there are other tests that apply in more specific scenarios.
I previously wrote some other posts about applying statistics in Power BI using DAX only like AB testing using Power BI so in this other DAX statistics post I wanted to show that implementing a Chi-square test in Power BI using DAX only is perfectly feasible it just requires a bit more work than typing two lines of code in R but with the help of some bulti-in DAX functions the result is great.
The Power BI
Here is the Chi-square test in Power BI
7 thoughts on “Chi-square test in Power BI”
Excelente Post. Is the Pbix avalilable to download for practice?
Hi Marco,
yes sure here is the link to download the file
https://github.com/f-benoit/PowerBI/raw/main/Chi%20Square/chi-square%20test.pbix
Hi Ben, great post! Just wondering what the CI table looks like and how you imported/coded it into the file?
Hi ALex,
Thanks four your comment. For the CI table I manually entered the data I entered four values: 99%,95%,90% and 80% for both one-tailed and two-tailed with their alpha and critical values. I took those four probabilities only because they are most comonly used.
Hi, thanks for this. It seems like a good approach for a single test. But I’m trying to do significance testing on a pbix for hundreds of tests, for about 10 ‘improvement’ columns, and 40 treatments. I would want to turn the treatments into treatment x vs all other treatments. So I think creating 10 measures which are dynamic in relation to the treatment selected would be a good way to do this. But I’m not sure how I could use your approach to do this. Any ideas? Thanks
How can I filter the summarised contingency table based on additional categories in the source table or, can I write the measures directly into the source table (without the need for the contingency table) so I can add slicers to the visual, allowing me to filter the whole dashboard by date, etc.?
Hi Lewis,
As long as you can calculate the ratio treated/not treated as well as improved/not improved you can use any other columns in your model to filter the data for exemple the date if you run multiple test at different date.
For the degree of freedom you have to make sure to only take into consideration the number of columns related to the variables that you are comparing so the date column should not count as a column in this scenario.
So yes you can rewrite the measure in the souce table directly as long as the ratio remain correct but you may need to adapt a bit my code for that.